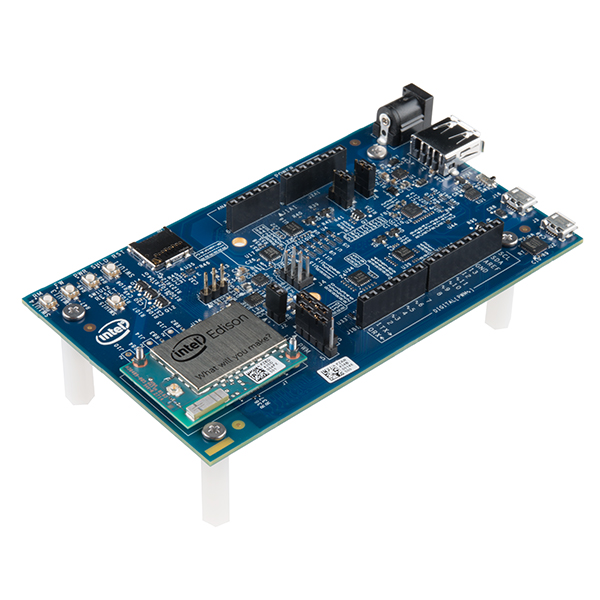
Breadboard for "Grove - RGB LCD temperature display"

Fritzing diagram: grove-lcd-rgb-temperature-display.fzz
Run this example from the command line with:
node eg/grove-lcd-rgb-temperature-display.js
var five = require("johnny-five");
var board = new five.Board();

board.on("ready", function() {

  // Plug the Thermometer sensor module
  // into the Grove Shield's A0 jack
  var thermometer = new five.Thermometer({
    controller: "GROVE",
    pin: "A0"
  });

  // Plug the LCD module into any of the
  // Grove Shield's I2C jacks.
  var lcd = new five.LCD({
    controller: "JHD1313M1"
  });

  var f = 0;

  thermometer.on("data", function() {

    // The LCD's background will change
    // color according to the temperature.
    //
    // Hot -> Warm: Red -> Yellow
    // Moderate: Green
    // Cool -> Cold: Blue -> Violet
    //
    // Experiment with sources of hot and
    // cold temperatures!
    //


    if (f === Math.round(this.fahrenheit)) {
      return;
    }

    f = Math.round(this.fahrenheit);

    var r = linear(0x00, 0xFF, f, 100);
    var g = linear(0x00, 0x00, f, 100);
    var b = linear(0xFF, 0x00, f, 100);

    // console.log("Fahrenheit:  %d°", f);

    lcd.bgColor(r, g, b).cursor(0, 0).print(f);
  });
});

// [Linear Interpolation](https://en.wikipedia.org/wiki/Linear_interpolation)
function linear(start, end, step, steps) {
  return (end - start) * step / steps + start;
}
Additional Notes
For this program, you'll need:


